Public Sector Pay Inequality Dynamics in Baltimore, Boston, and New York City
In recent years, major cities have published high quality data on their payroll’s annual salaries and overtime earnings. City newspapers such as the Baltimore Sun, the Boston Globe, and the New York Post report each year on the superstar pay, often driven by overtime pay, earned by a few local public employees. This report highlights trends in public sector pay inequality in Baltimore City, Boston, and New York City in recent years.
The rise in income inequality has been a topic of growing importance and concern with an emerging body of literature investigating the trends and causes, but this research has mainly focused on trends in private sector pay inequality. City governments have key responsibilities for providing basic services that form the backbone of urban quality of life. Cities face budget constraints. Broadly given a tax base, city governments can allocate funds to either operating or capital budgets, investing in labor or infrastructure maintenance and improvements. This raises questions of opportunity cost.
Our key findings include:
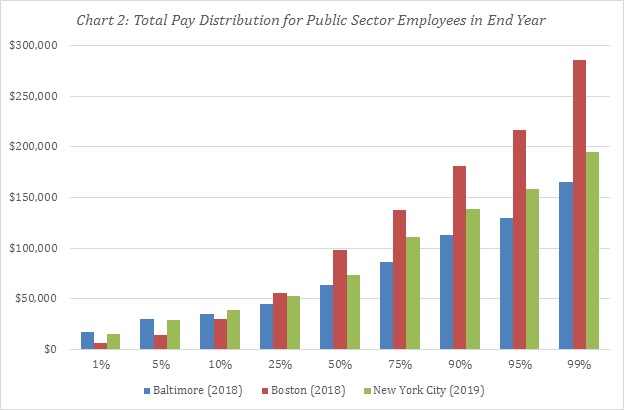
- We observe inequality in pay between the three cities. In the final year of data, median total pay for public sector employees in Boston was 55% higher than in Baltimore and 32% higher than in New York City. The public sector employee at the 99th percentile in Boston earned 72% more than in Baltimore and 47% more than in New York City.
- Those at the top of the pay distribution have a much higher percentage of their total pay coming from overtime pay, and this disparity is worst in Baltimore. Overtime pay as a percentage of total pay in 2018 in Baltimore was 40% for employees at the 99th percentile and above compared to just 7% for those near the median. In Boston, these same numbers were 22% at the top of the pay distribution compared to 7% at the median and in New York City it was 18% for those at the top of the distribution and 10% for those at the median.
- Total pay inequality grew in all three cities over the observed time period, with the highest growth occurring in Boston and Baltimore, but the highest inequality persisting in New York City between the median and the 90th percentile. The ratio of total earnings in 2011 between the 90th percentile and the 50th percentile in Boston was 1.71 while in 2018 this disparity grew to 1.85. In Baltimore, this ratio increased from 1.6 to 1.79. In New York City, the ratio grew only slightly from 2.61 to 2.63.
- A gender gap in earnings is observed in all three cities. These gender gaps have slightly narrowed in recent years. The female to male median total pay ratio at 79.62% in Baltimore, 71.17% in New York City, and 59.37% in Boston.
- Male employees dominated the share of those earning total pay over $200,000 in all three cities in the end year of data. The number of male employees receiving total pay over $200,000 in Baltimore was nearly three times higher than the number of female employees. This same measure was five times higher in New York City and 18 times higher in Boston.
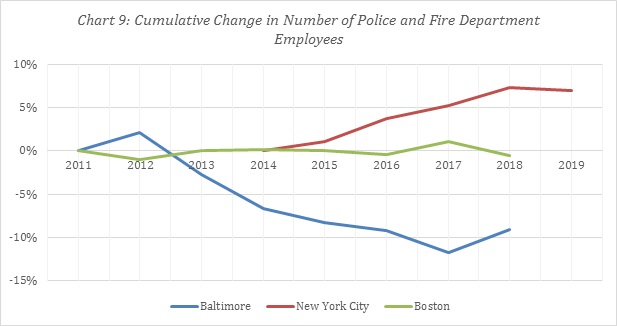
- Baltimore was the only city to experience a decline in the total number of public sector employees over the observed period. Baltimore lost 856 employees for a 7% decrease, which included 449 fewer employees in the police and fire department. During the same time period as Baltimore, Boston increased their number of public sector employees, gaining 886 employees for an 11% increase. Similarly, New York City increased their number of public sector employees, gaining 17,736 employees for a 10% increase.