
BSEC Surface Weather Data
To understand the causes and develop equitable solutions for urban heat, flooding, and air pollution it is necessary to have neighborhood-scale information on weather conditions (e.g., air temperature, humidity, and rainfall). This is particularly true as these conditions are not evenly distributed across cities. For example, low-income communities are often in the hottest neighborhoods with little vegetation, few trees, and large areas of impervious surfaces.
However, there is lack of surface weather measurements within cities, especially in low-income communities, which prevent needed analysis of the causes of spatial variability, and the efficacy of active or proposed interventions. Federal and state agencies only make meteorological measurement at a few stations within or near Baltimore city (see map below). These measurements are insufficient to evaluate which populations are being exposed to high heat. In recent years, there has been a growth of weather stations owned by individuals. However, the lack of documentation on types of instruments and placement (e.g., roof versus ground) of these personal weather stations makes it difficult to determine the true spatial variations in near-surface air temperature. Furthermore, and perhaps most important, these personal weather stations are not uniformly spaced across the city, with very few in low-income neighborhoods to the west and east of the city. In other words, even with personal weather stations there are still meteorological measurement deserts within Baltimore City.
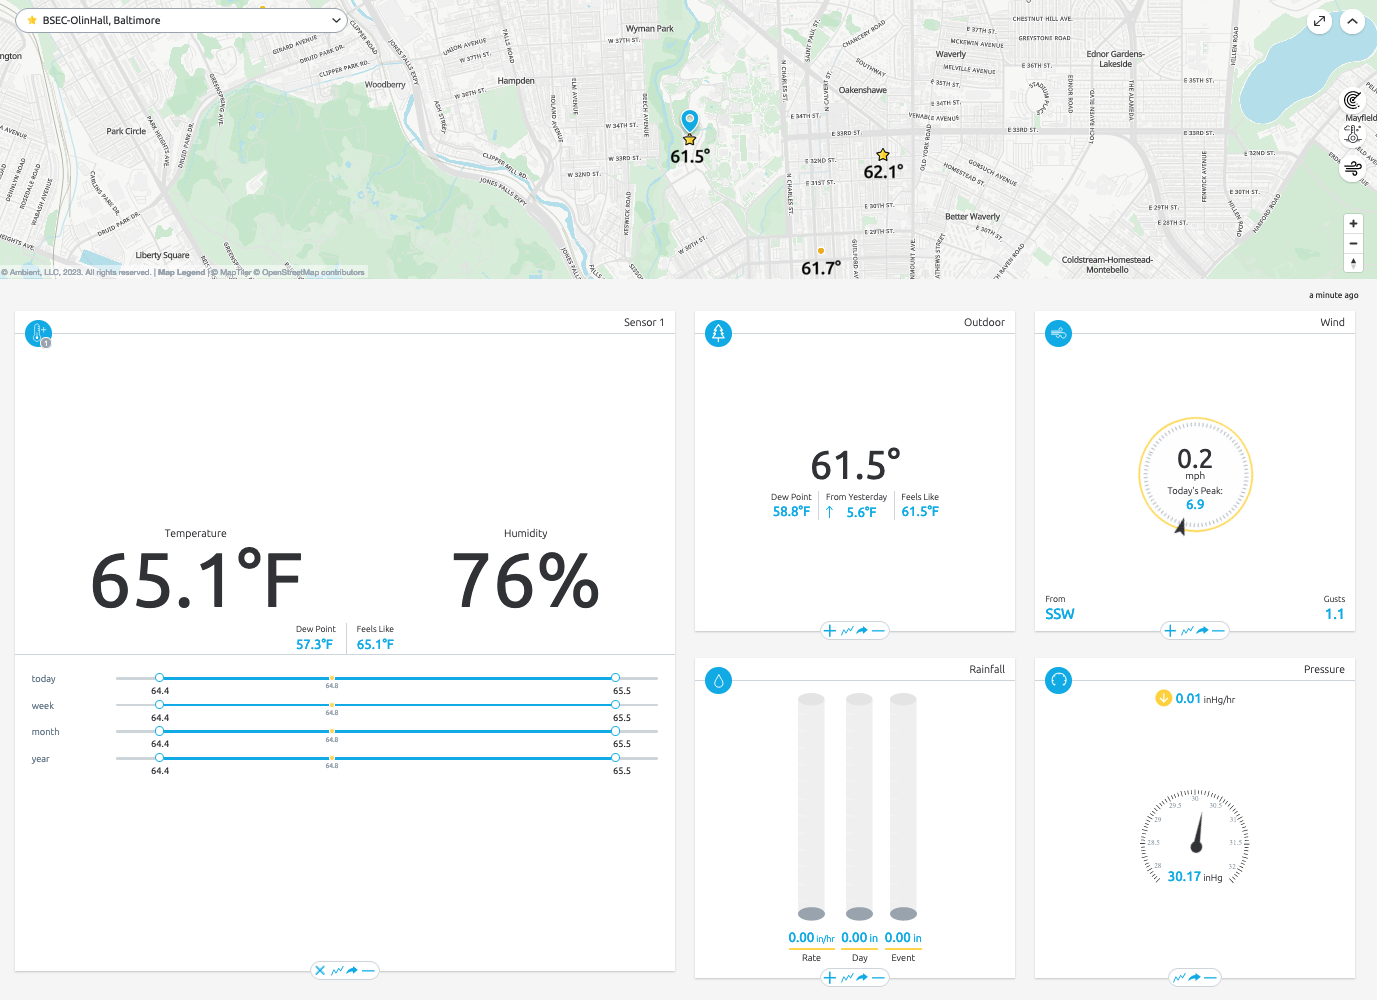
To address this lack of data, the Baltimore Social-Environmental Collaborative (BSEC) is placing instruments to measure weather conditions within Baltimore City, with a focus on under-served neighborhoods. The locations of these stations are shown in map and table below.
Information of the instruments and how to access real-time data is here for the Ambient Weather (AW) stations and here for the OttHydro (Ott) stations. An archive of data from all stations can be found here.
Read this newsletter article about our weather stations and see this presentation from the 2024 AMS annual meeting.
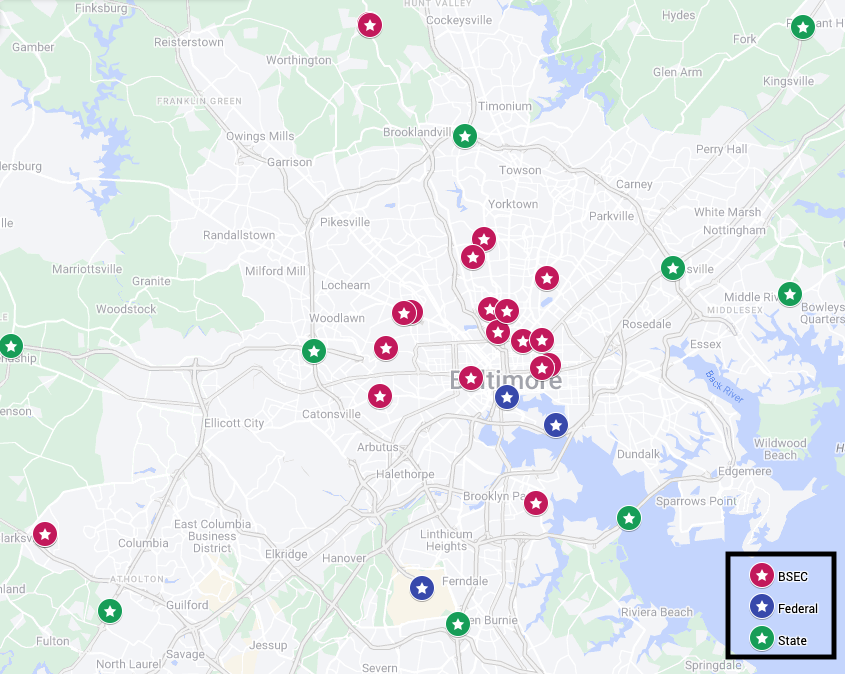
Table: Weather Station Locations
| ID | Site Name | Latitude | Longitude | Station Type | Start Date |
| AAC | Allen AME Church | 39.29 | -76.63 | AWS | 5/19/2023 |
| ABL | Abell | 39.32 | -76.61 | AWS | 8/8/2023 |
| AGC | Amazing Grace Church | 39.30 | -76.58 | ASW | 8/8/2023 |
| ARK | Ark Church | 39.31 | -76.60 | AWS | 7/18/2023 |
| CLV | Clarksville | 39.21 | -76.93 | AWS | 4/1/2023 |
| CMN | Carrie Murray Nature Center | 39.31 | -76.69 | OTT | 7/19/2023 |
| COV | Cockeysville | 39.47 | -76.70 | AWS | 3/23/2023 |
| OTT | 7/7/2023 | ||||
| COV2 | Cockeysville Site 2 | 39.47 | -76.70 | AWS | 8/8/2023 |
| OTT | 9/27/2023 | ||||
| DSG | Duncan Street Miracle Garden | 39.31 | -76.59 | OTT | 8/8/2023 |
| FSG | Filbert Street Garden | 39.22 | -76.59 | OTT | 7/21/2023 |
| JHU | Johns Hopkins University-Homewood | 39.32 | -76.62 | AWS | 4/3/2023 |
| OTT | 7/17/2023 | ||||
| LGC | Liberty Grace Church | 39.32 | -76.67 | AWS | 5/4/2023 |
| LRT | Liberty Rec & Tech Center | 39.32 | -76.68 | OTT | 8/3/2023 |
| MSU | Morgan State University Site | 39.34 | -76.58 | OTT | 6/28/2023 |
| NRP | North Roland Park | 39.36 | -76.63 | AWS | 6/8/2023 |
| OG | Old Goucher | 39.31 | -76.62 | AWS | 5/31/2023 |
| RPL | Roland Park Library | 39.36 | -76.63 | OTT | 7/11/2023 |
| SMF | Stillmeadow Fellowship | 39.28 | -76.69 | AWS | 5/17/2023 |


