

Divestment & Reinvestment in East Baltimore
Project leads: Phil Garboden and Christine Jang
While the scattered incidents of civil unrest that accompanied the Baltimore Uprising made for dramatic media images, it was the background, not the foreground, of those photographs that truly told the story. The Sandtown neighborhood is a landscape of concentrated abandonment; its blocks upon blocks of vacant and abandoned housing have become a ubiquitous reminder of the national failure to support urban neighborhoods and Baltimore’s legacy of discriminatory housing policy. These forces combined to lock African American communities across the city into a decades-long cycle of divestment and abandonment.
For much of the last two decades, urban decline was taken as given. Nothing, it was thought, could be done to stem the exodus of middle-income families from the urban core. But in the past few decades, American cities have seen an unexpected reversal of fortune. Instead of collapsing, as was widely predicted, many former industrial cities are increasing in population for the first time since World War II. Almost overnight, the policy discussion shifted from large-scale demolition, “right-sizing,” “moth-balling,” and metropolitan annexation to neighborhood revitalization projects with the potential to reverse decades of neglect.
But this trend generated concerns as well. If market forces are driving neighborhood revitalization, how can policy be structured to ensure that legacy residents – those who could not or would not leave the neighborhood – benefit from the renewal? Will the revitalization process follow the well-documented pathways of gentrification and displacement, or is a third way possible – a virtuous cycle of renewal that recreates diverse mixed-income neighborhoods?
In 2015, researchers from the Poverty and Inequality Research Lab set out to address these issues with an in-depth case study of East Baltimore. The researchers focused on three questions: 1) What does the process of neighborhood revitalization look like? 2) What factors drive supply-side actors (landlords and developers) to invest in a neighborhood? 3) What effect are the changes having on community demographics – who’s moving in, who’s staying, and who’s leaving?
This document presents some initial findings from a small portion of this research, focusing on the spatial distribution of investment.
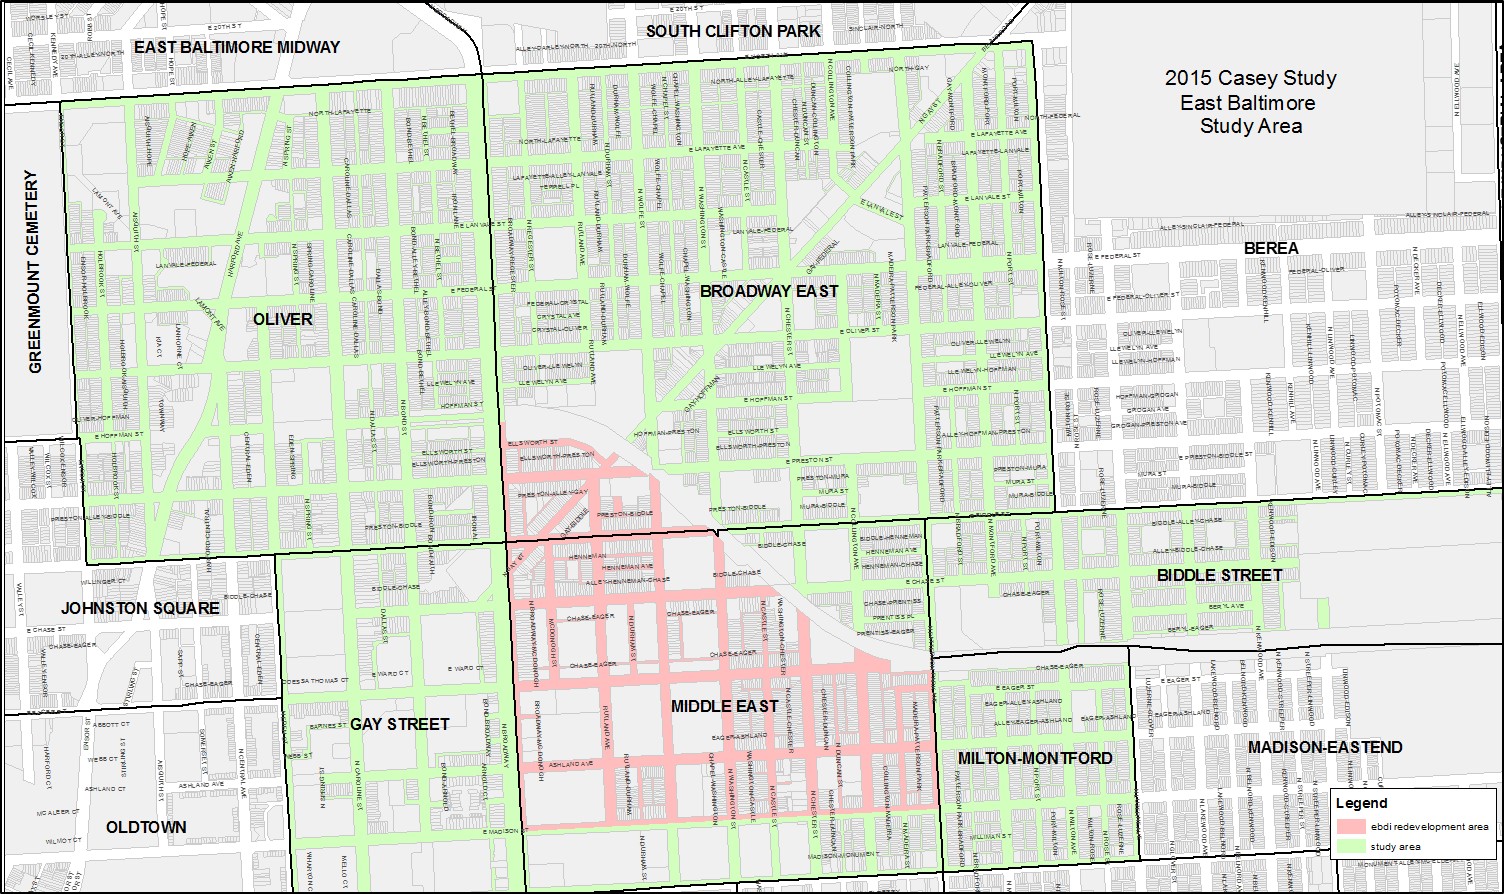
Map 1: East Baltimore Study Area
Our study focused on the five neighborhoods immediately adjacent to the East Baltimore Development Inc.
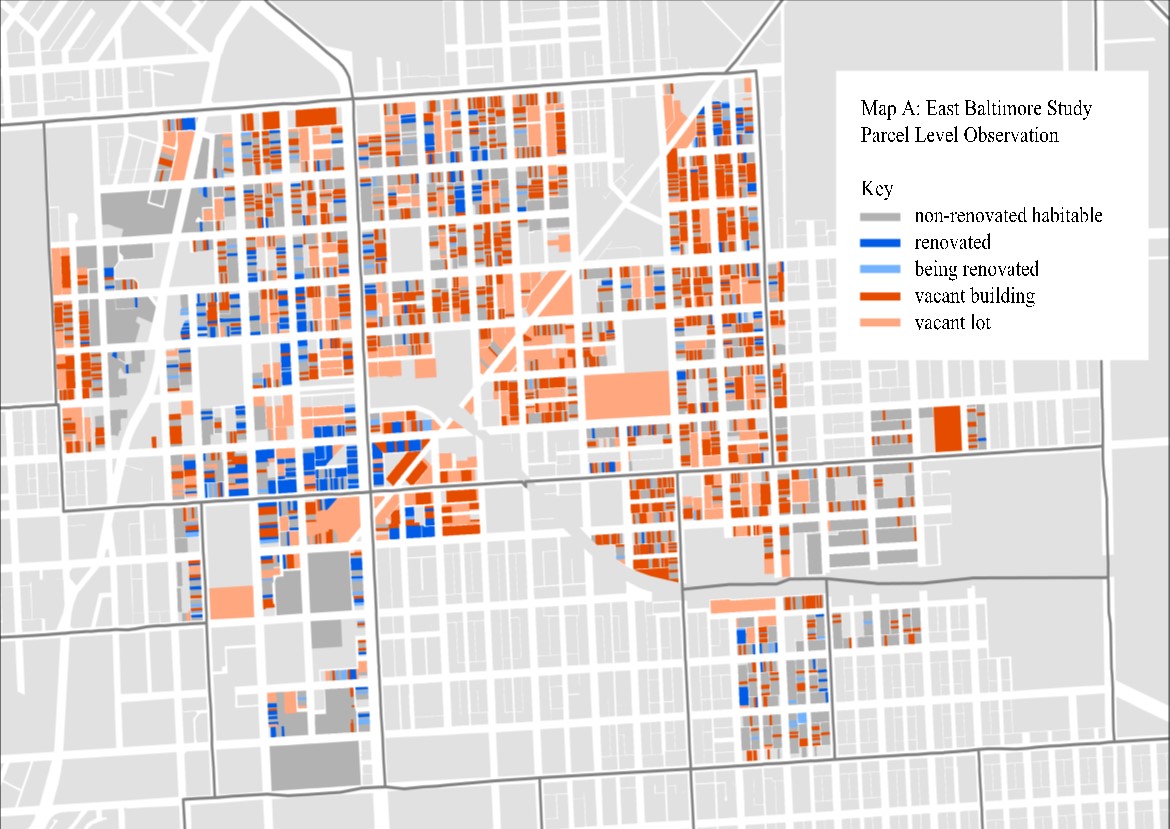
Map 2: Patterns of Abandonment and Reinvestment
At the moment, East Baltimore is a tale of two neighborhoods. In Broadway East, the legacy of divestment is very much evident in the hundreds of abandoned properties. By contrast, Oliver is showing unprecedented levels of reinvestment and property rehabilitation.
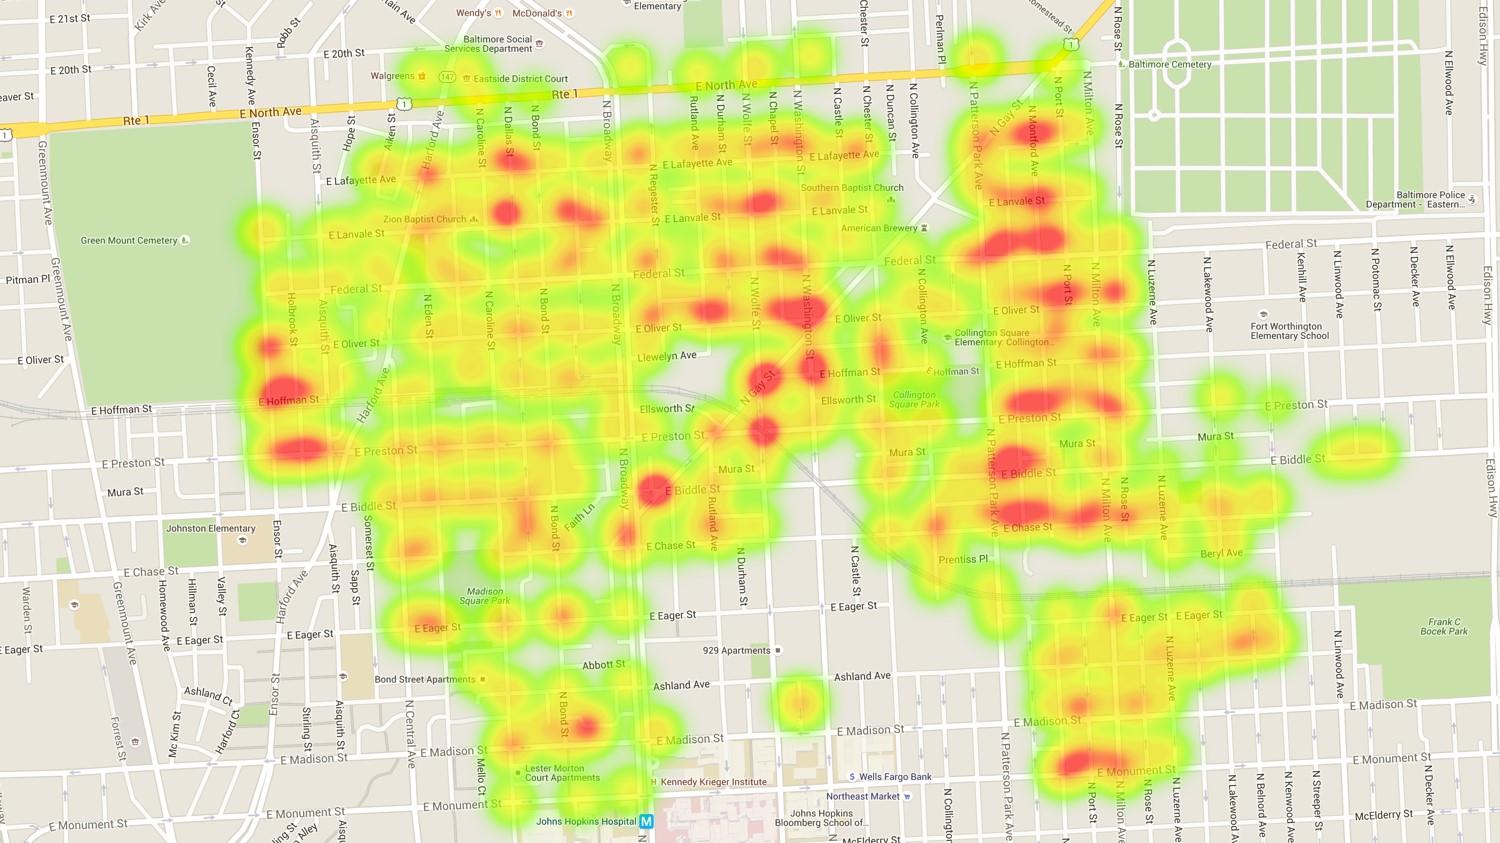
Map 3: Trash On Street Heat Map
As new residents move into Oliver, there is noticeably less trash in the street. New residents mean more people invested in the neighborhood, and neighborhood cleanups are frequent in the area.
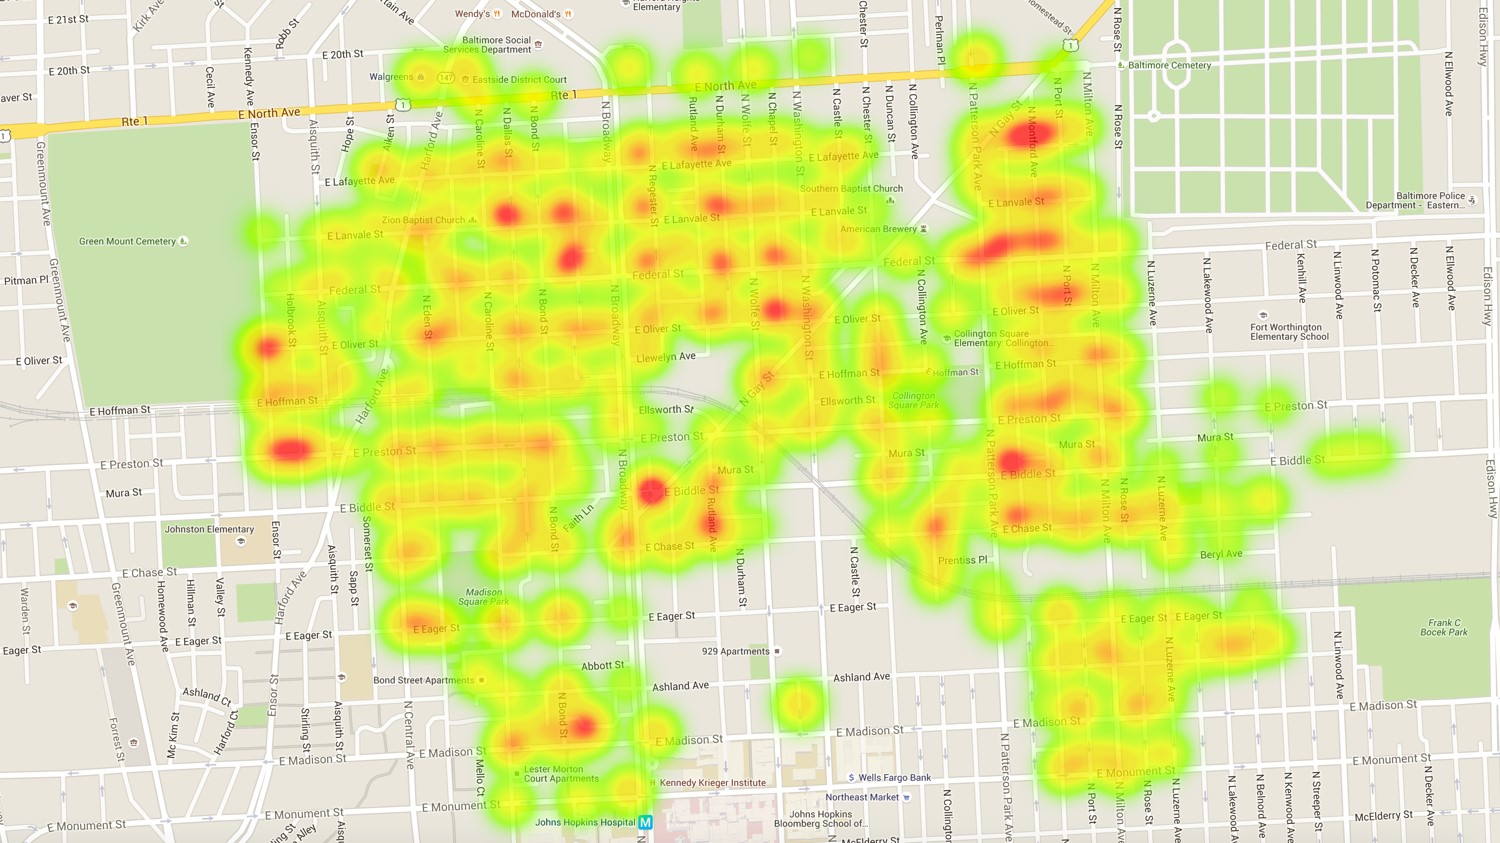
Map 4: Cigarettes On Street Heat Map
Because they are hard to clean up and correlated with population, there is much less difference in the number of cigarette butts in the gutters than in trash overall.
These maps are just a few examples of our work in East Baltimore, which includes interviews with developers, new residents, legacy residents, and public officials. This work would not have been possible without our three 21CC Summer Interns: Mollie Cueva-Dabkoski, Brianna Bueltmann, and Ben Schwartz.
To learn more, please email Philip ME Garboden at [email protected] or Christine Jang at [email protected]


